

This is a visual story of where stuff is made, moved and consumed.
From production to export, import to consumption, we’ll explore the flows of the world’s most crucial commodities and products.
Below is $21 trillion of global trade. Box size represents exports by dollar value.

We’ll dive into a hand-picked selection of the big ticket items above in this four part series.
In Part 1 (this post), we run through the primary sector: agricultural products (beef, soybeans, wheat etc).
Then in Part 2, we’ll dig into minerals, metals, and industrial materials (coal, crude oil, iron ore etc).
Next in line, in Part 3, we’ll examine the secondary sector. Manufactured goods ranging from everyday consumer goods through to more advanced engineering marvels.
Finally, in Part 4, we’ll cover the tertiary sector: services.
Now it should come as no surprise that the biggest countries stand as the biggest producers, the biggest exporters…

… as well as the biggest importers…

… and the biggest consumers of stuff.
However, big countries’ big production usually caters to their domestic consumption demands. For instance, China is the world’s leading rice producer with 211M tonnes of annual production…

… but they eat most of it… leaving India as the leading exporter with 22M tonnes.

Our interest therefore lies in the critical few nations that wield a disproportionate influence over global supply and demand.
In particular, we’ll identify supply monopolies – the key exporters of critical upstream raw materials. As well as demand monopolies – the key importers of downstream finished products. To illustrate this, let’s take coffee for instance.
It goes without saying that coffee is a crucial commodity. Much of humanity’s intellectual stimulation and consciousness depends on it. And if we ever ran out, a lot of people would be upset.
Further elevating its importance, coffee production is highly concentrated along the bean belt.

And climate change is threatening this – both longitudinally (thinner bean belt) and altitudinally (being forced to go higher up the hills).
As we’d expect, the top coffee producers – Brazil, Vietnam, and Colombia – are…

… also the top exporters.

But oddly enough, Western Europe are big exporters too.
This is because they import raw coffee beans and process (roast, decaffeinate etc) them for exports.

So coffee is a cautionary tale of solely looking at aggregate export data. We need to identify the upstream suppliers of raw input materials. In fact, my initial disbelief seeing Germany in this visualisation below is part of what prompted me to write this post.

With this intent in mind, let’s jump in.
Part 1: Agricultural Commodities
Dairy: We’ll start with our first taste of the world. Milk, butter, cheese, and other animal origin products (eggs, honey etc). New Zealand is the world’s dairy queen.

Important note: The substantial amount of ‘European purple’ you’ll often see as both top exporters and importers reflects intra-EU trade. This is akin to American states trading with each other. Keep this in mind throughout this post.
Beef: Brazil, US, Australia, NZ, and surprisingly India are the top exporters (as it includes water buffalo)… both in dollars…

… as well as metric tons. Notably, Argentina sells their beef at a lower price per ton.

France, Australia, Canada lead live stock exports though.

Again, we see lots of ‘European’ purple on both sides here. So Asia primarily imports frozen beef, while Europe imports live cattle.
Chicken: Poultry comes from Brazil and the US…

… as does most pork.
Pork: By now you may have noticed that Asia doesn’t export much meat. This is most evident looking at pork exports. Look how little red there is below for exports on the left.

Lamb and mutton: While China likes ANZ lamb, it’s not much of a hit in the Muslim nations. Not halal.

Live goats from Romania, Sudan, Iran, and Somalia, however, are highly popular in the Middle East.

Seafood: Norway, Vietnam, and Chile punch above their economic weight as top exporters.

Enough protein, now onto veggies.
Live plants: Bulbs. Seedlings. Flowers. Despite ranking 131st globally on land area, Netherlands is the Europe’s nursery. Note the low trade volume outside of EU indicates that countries in other regions mostly self-produce.

Vegetables: Spain and Netherlands supply Europe’s vegetables. Mexico supplies America’s.

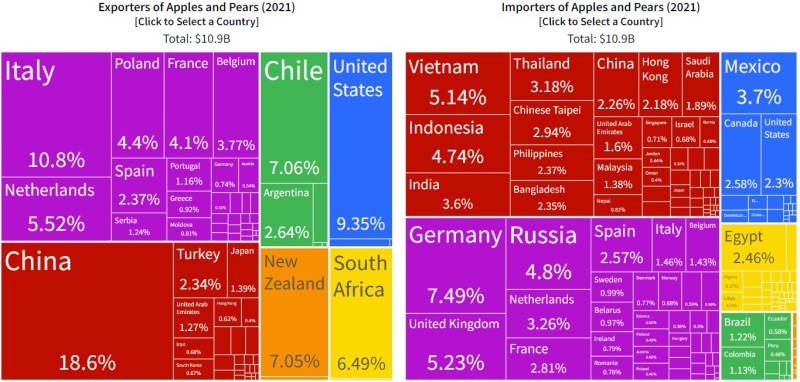
Fruit and nuts: Looking at $147B in aggregate, it’s fairly dispersed.

Let’s break this down further.
Apples and pears come from more temperature climates.
Bananas: Central America (Ecuador, Costa Rica, Colombia, Guatemala) and Philippines.

Berries: Thailand and New Zealand supply Asia. Spain and Netherlands supply Europe. Mexico and Peru supply the Americas.

Citrus fruits: Spain and South Africa.

Nuts: US and Turkey are notable exporters.

Now we move onto key staples, starting the most important one, soybeans.
Soybeans: Brazil is the world’s pantry. 85% of global soybean exports come from Brazil and the US.

More than half of this ends up in China – serving as a key ingredient in tofu and livestock feed.
In fact, $23B of Brazilian soybeans going to China is the world’s biggest agricultural trade flow, by a long margin.

US soybean production is actually on par with Brazil’s but it consumes most of it domestically (mostly to feed livestock).

Wheat: Although China and India are top producers, they consume most of it. Top exporters are temperate-climate landmasses: Russia, Canada and US.

Unlike other commodities we’ve looked at so far (meat, fruit and vegetables), Africa imports a lot carbs.

Rice accounts for 20% of humanity’s calories. While north Africa prefers wheat, sub-Saharan Africa prefers rice.
Recall from the intro, top exporters are India, Thailand, and Vietnam. Vietnam temporarily banning rice exports Mar-May 2020 at the height of COVID fears is a prime example of global supply fragility.

Corn / maize: Used for making corn syrup, a cheap substitute for sugar. US, China, and Brazil are the top producers.

US, Brazil, Argentina, and Ukraine are top exporters.

Supply growth has been met outside of the US.

We’ll now slip into oils.
Soybean oil: Unsurprisingly, Argentina and Brazil are top exporters. India is the top importer for many oils.

Olive oil: Spain, Italy, and Greece satiate the demands of the Western world’s most preferred cooking oil. However, at only $9B, note its relatively small trade volume compared to other oils.

Palm oil comes from Indonesia and Malaysia. Most of this ends up India and the rest of Asia.

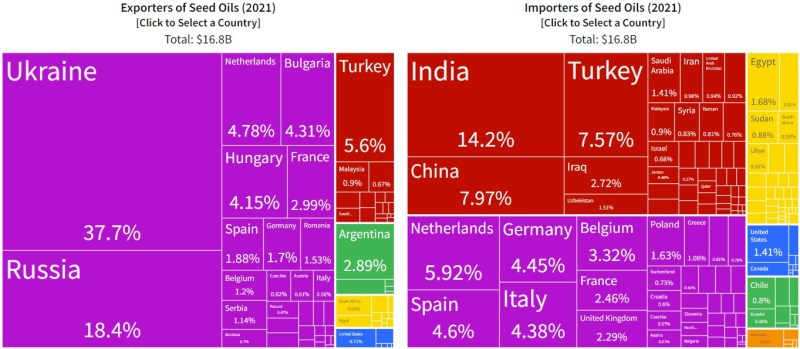
Seed oils (eg sunflower oil) come from Eastern Europe.
Rapeseed oil (inc canola oil) comes from Canada, Germany, and Russia. Fun fact: canola oil comes from Canada’s genetically modified version of rapeseed. ‘Canola’ is ‘Can’ for Canada + ‘ola’ for oil.

Next, the stimulants.
Coffee: We already covered coffee in the intro, but will add on 3 more points.
The second-highest producer, Vietnam, beats third place Colombia by more than double. More impressively, Vietnam boasts the highest coffee yields in the world.

Second, Africa barely drinks any coffee (very little yellow in bottom right), preferring tea (as we’ll cover next).
Third, Ethiopia, the birthplace of coffee, stands as an exception. Its unique historical status of having experienced minimal to no European colonialism has shaped their approach to their prized produce, reserving the best for local consumption.

Tea: China, Sri Lanka, and Kenya are top exporters. Russia, Britain, Asia and Africa can’t get enough of it.

Green tea comes from China, Vietnam, and Japan. Black tea (in <3kg packages) comes from Sri Lanka. Black tea (in >3kg packages) comes from Kenya.
Fun fact: Cha by land, tea by sea.

Wine: Top exporters are the romantic European nations: France, Italy, and Spain.

Top importers are the rich nations.

Basically, prejudices on European diets is warranted by the data: tomato, potato, wine, beer, spirits, olive oil, butter, tea, coffee.

Sugar: Brazil, India, EU, and Thailand are the top producers.

While Brazil exports most of this raw…

… India leads the way in refined sugar exports (surpassing Thailand a few years ago). Notably, Germany and France produce and then refine substantial amounts for European consumption.

That a sweet end to edible agricultural commodities.
Now there’s an array of non-edible agricultural and forestry commodities to cover: wood, paper, cotton etc.
We’ll touch on wood here. Building on this, we’ll get a grip on rubber in Part 2: Mining and Industrial Goods. Then flick through paper and iron out clothing materials (cotton, wool, leather) in Part 3: Manufactured Goods. (Sorry about the puns. I can’t help it. Almost done…)
Lumber: Looking at wood exports in aggregate ($189B) is highly misleading as it includes processed wood like fiberboard ($13B) and plywood ($21B), as well as various finished products like crates ($5B), kitchenware ($2B), ornaments ($3B) etc.
The most upstream wood, sawn wood ($56B), is supplied by Canada, Russia and Sweden’s vast forestry. Asia imports a lots of raw wood from outside the region…

… with the exception of Vietnamese fuel wood (100% of which goes to Asia).

New Zealand is a top exporter of rough wood.

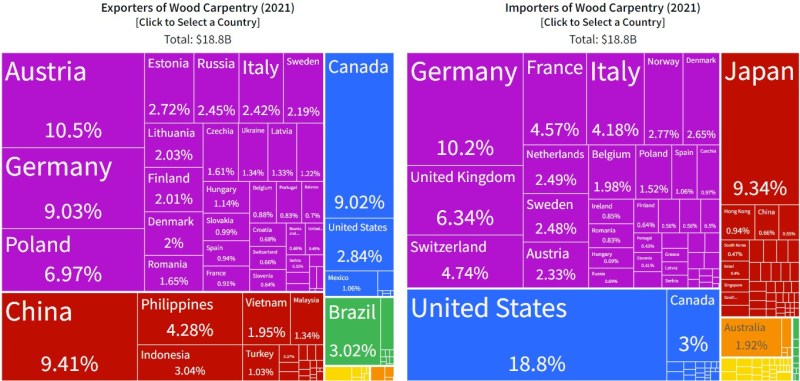
Trade of high-quality carpentry wood used in construction is highly regionalized: Europe supplies Europe, Canada supplies US, China-Philippines-Indonesia supplies Japan etc.
Fertilizer: While technically not an agricultural product, it’s undoubtedly a key input so I’ve included this here. Overall, Russia, China, Canada, and Morocco are the top exporters. Agricultural giant Brazil is the biggest importer.

Consider 5 types of fertilizer, $95B of global exports can be decomposed as: animal or vegetable ($1B), nitrogenous ($37B), phosphatic ($3B), potassic ($19B), and mixed ($35B).
No surprise, China leads fertilizer production.

Nitrogenous fertilizer exports come from China, Russia, and the Middle East.

Phosphatic fertilizer exports come from China, Morocco, and Egypt. Top importeres are Brazil and Bangladesh.

Potassic fertilizer comes from Russsia and Belarus.
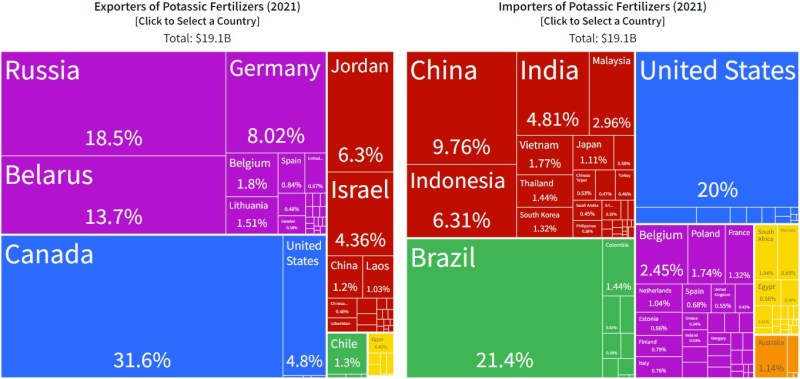
Brazil (the pantry of the world) and Mexico are most vulnerable to Russian political unrest with Belarus and Ukraine.

Mixed or chemical fertilizer: top exporters are a mix of the above, China, Russia, Morocco.

We covered so much. Yet we only skimmed over a fraction ($2.2T) of global goods trade ($21.0T).

Next in Where Stuff Is Made Part 2, we’ll uncover Minerals, Metals and Industrial Materials.
Whenever I’ve accumulated enough interesting things to share, I send out an email newsletter. Subscribe here:
If you enjoyed this, you may also enjoy:
Where Stuff Is Made: An Illustrative Overview (Part 2: Minerals, Metals, and Industrial Materials)
Where Stuff Is Made: An Illustrative Overview (Part 3: Manufactured Goods)
Where Stuff Is Made: An Illustrative Overview (Part 4: Services)