

This is a visual story of where stuff is made, moved and consumed. From production to export, import to consumption, we’ll explore the flows of the world’s most crucial commodities and products.
In Part 1 we covered $2.2T of agricultural products. Then in Part 2, we went over $6.6T of minerals, metals, and industrial materials. Now in Part 3, we dive into the secondary sector: $12.2T of manufactured goods.
We’ll start with the simplest, most basic, everyday household goods – clothing and furniture. Then we’ll progress to products of advanced manufacturing such as pharmaceuticals, integrated circuits, and aircraft.

Cotton: While technically an agricultural product, we’ve included cotton here as it’s a key upstream input to the apparel category. China and India are the top producers overall.

The $62B of global cotton trade supports this, with both countries also being the top exporters. Here, we can also see that Bangladesh is a major cotton importer.

However, spinning out $19B of raw cotton from the above reveals a different narrative.

China, Vietnam, Bangladesh, Turkey, and Pakistan are highly dependent on importing raw cotton feed from just a handful of raw cotton exporters. Just look at how much Asian red there is on the right below.
Now, looking at the finished product…
Clothing: Below is the global $261B knitted clothing accessory trade. The trend is generally the same for $229B of non-knitted clothing accessories too.

Below shows exports only. Notably, Italy and Germany rank surprisingly high. This is because exports are measured in dollars (think Italian suits).

More importantly, it’s clear that Bangladesh and Vietnam are the clear contenders as top exporters after China.
However, Vietnam is hands-down #2 for footwear exports.

Leather bags: Of the $105B Animal Hides category, $81B is leather products. Of this, $68B are leather bags (trunks and cases). After China, it’s France and Italy… those luxury handbags.

Now we move onto the 3rd biggest eCommerce category: furniture.

Furniture: Includes usual furniture ($112B), seats ($97B), light fixtures ($64B), mattresses ($23B), and more.
Notable top net exporters after China (emphasis on net) are Vietnam, Poland, and Italy. IKEA’s list of its top supplying countries validates this.

Again, Vietnam is particulary noteworthy here. Helped by its low wages and proximity to China, it’s done particularly well in capturing China’s spillover. Especially as more global firms adopt a “China plus one” strategy to diversify their manufacturing base.

Cosmetics: France, South Korea, and Japan are leading net exporters. Below is the $154B perfumery and cosmetic category in aggregate.

This is even more pronounced when we drill down to the largest subcategory: beauty products.


Korea in particular has done well selling to China. K-pop soft power?

Toys: Includes sports equipment, video and card games, party decorations, outdoor recreational equipment etc. At $164B, trade volume for entertainment is on par with elevating beauty.

China wins in this space. Both export and import proportions are more or less the same for the component subcategories too.

Paper Goods: Surprisingly big category at $295B.

Trade is highly regionalized. Africa’s imports of paper goods are disproportionately high compared to other goods the region acquires.

Here’s $2.2T of global trade in chemical products.

Pharmceuticals: Overall top exporters are Germany, Switzerland, US, Belgium, and Ireland.

US and Europe are major importers.

Most of this $806B consists of packaged medicaments and vaccines.

Packaged medication: Germany, Switzerland, India are major net exporters.

Vaccines: Switzerland, Ireland, Belgium, China are major net exporters.

Organic Chemicals: Huge category at $494B.

East Asia and Western Europe are the top exporters.

Now we move into the advanced manufacturing territory.
From here on, we need to be mindful when looking at export and import data. For most manufactured goods, the top exporters of finished products are also the top importers of the components of those products. This is because supply chains are highly globalised, especially for products with many specialised components.
Take the broad ‘electronics’ category for instance. This includes consumer electronics, industrial electronics, medical devices, automotive electronics, aerospace and defence elcetronics, and chips.
The top electronics exporters ….

… are also the top importers.

This is because of the highly vertically fragmented (ie extremely low vertical integration) and specialised nature of the global electronics value chain.
However, if we look at the top 10 electronics exporters and subtract their corresponding electronics imports, a completely different narrative comes into focus.

Here’s a more recent update on top electronics exporters.

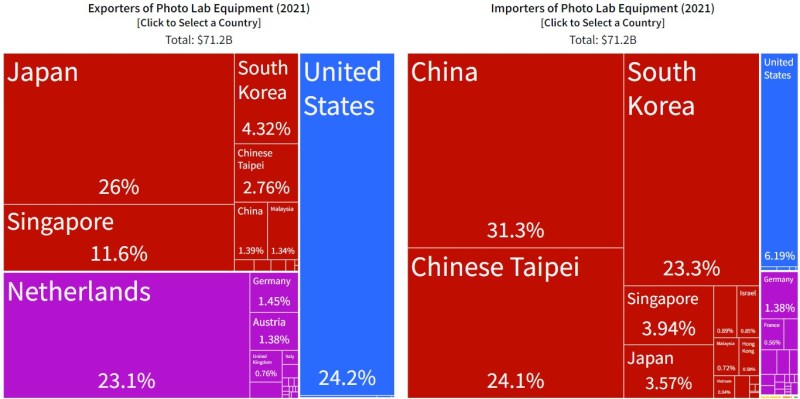
Instruments: Mostly optical, photo & film equipment, and medical instruments, below is $792B of global ‘instruments’ trade.

Let’s drill into the top two: medical instruments and photo lab equipment.
Medical Instruments: Mexico and Ireland punch above their weight as exporters.

Photo Lab Equipment: Japan, US, Netherlands, and Singapore control exports. China, Taiwan, and South Korea dominate imports.
Next, we’ll pick out select items from the behemoth $3T electrical machinery and electronics category.

Domestic household appliances: While trade volume is smaller than other electronic categories, the broad nature of this category makes it a useful indicator of general appliance manufacturing origins. As anticipated, China exports and US imports.

Phones: iPhones are assembled in China; Samsung smartphones in Vietnam.

Broadcasting equipment: For radio or TV; includes cameras and recorders etc. At $473B, this category is about 4x larger than phones.
Exporters are similar as above with phones. But importers are US and Europe.

Integrated circuits: The pinnacle of advanced manufacturing. At $823B, global chip trade is bigger than that of petroleum ($746B), and just a little under crude oil ($951B). With TSMC, Taiwan is the world’s high-end chip factory.

Now we look at a selection from $2.4T of machinery and mechanical appliances.

Computers: China still dominates computer exports. Mexico is still up there too. The US is a major net importer.

Interestingly, almost 60% of the $352B above is mostly data storage units.

And here’s a map view of above with 2019 data. Same story.

Office Machine Parts: Basically printers, office IT hardware, cash registers etc. Compared to other electronic hardware, Chinese export dominance is less pronounced here. Asia leads.

Now we move onto large mechanical hardware.
Gas turbines: Aviation powerhouses, US, UK, and France are key players.

Trade is quite fragmented for the other major machinery items. For instance, we see this with…
… Valves…

… Air pumps…

… Refrigerators…

… although with Air Conditioners, Thailand and Mexico are notable exporters.

Next, we have plus-sized hardware: $1.9T of transportation vehicles. Breakdown looks like this:
For road vehicles overall ($1.5T), top net exporters are: Japan, Germany, Mexico, and South Korea.

China, Mexico, Korea, Thailand, and Turkey have grown their market share substantially. Japan and Canada’s, however, has plumetted.

Cars: The above trends are amplified when we drill into cars only (at $723B, half of the make-up of above). Germany and Japan account for 30% of global exports.

There’s 3 points to call out here.
First, while global automobile production is indeed dominated by the top 15 auto giants, their manufacturing (and hence export) origin country is not necessarily the global HQ’s domicile. It’s spread all over the world. For instance, below shows the (shrinking) British car industry.

Second, although cars represent the top export category for many European nations (lots of purple on left export part of the global car trade graphic above)…

… these same countries import a lot of cars too (lots of purple on right import part of the global car trade graphic shown again below).
Third, China has successfully reduced its import reliance on this very expensive item. Measured by count rather than dollars, Chinese production is global #1.

Trucks: Mexico specializes in truck production. Thailand is big on exports too. Mining giants Canada and Australia are a disproportionate importers.

Also, American automobile production has shifted away from cars and towards trucks in recent decades.

Ships: Here’s $135B of marine vessels and structures broken down. It’s a big category, but smaller than trucks ($145B).

Overall, South Korea, China, and Japan are top exporters. Liberia, Marshall islands, Panama, and Cayman Islands are big importers.

Breaking this down into large passenger and cargo ships further accentuates the above insights. Both sellers and buyers are highly concentrated.

Aircraft: Here’s $184B of global aircraft trade.

France, US, and Germany lead exports.

And much like ships, when we drill into the top category (fixed wing aircraft unladen weight >15t) we see an amplification of export and import concentration. Ireland is a major importer.

Military: See my other post Lords of War: A Visual Exploration of Military Might for more.
By a long margin, the US and Russia are the world’s arms dealers.

The biggest buyers are states with cash, security-paranoia, and no legacy of advanced manufacturing: Saudi Arabia, India, Egypt. And to many’s surprise – Australia is the 4th largest buyer, ahead of China and Indonesia.

US arms go to Saudi Arabia, Australia, and South Korea. Russian arms go to India, China, and Algeria.

Below is a neat little summary of what we’ve covered so far: the most traded goods and the corresponding top exporters (green, left) and importers (yellow, right).

That wraps up $12.2T of manufactured goods.
Next and finally in Part 4, we’ll cover the tertiary sector: services (tourism, professional services etc).
If you enjoyed this, you may also enjoy:
Where Stuff Is Made: An Illustrative Overview (Part 1: Agricultural Commodities)
Where Stuff Is Made: An Illustrative Overview (Part 2: Minerals, Metals, and Industrial Materials)
Where Stuff Is Made: An Illustrative Overview (Part 4: Services)