

This is a visual story of where stuff is made, moved and consumed. From production to export, import to consumption, we’ll explore the flows of the world’s most crucial commodities and products.
In Where Stuff Is Made Part 1 we covered $2.2T of agricultural products.

Here in Part 2, we’ll dig into $6.6T of minerals, metals, and industrial materials.

Next in line, in Part 3, we’ll examine the secondary sector. Manufactured goods ranging from everyday consumer goods through to more advanced ones (cars, microchips etc). Finally, in Part 4, we’ll cover the tertiary sector: services (tourism, professional services etc).
Love it or hate it, there’s no denying that the world still runs on fossil fuels. Let’s go over the big 3: coal, oil, and gas.
Coal retains its throne as the primary fuel source for electricity generation. It’s the most extensively mined fossil fuel measured by cubic volume.

Developing economies tend to have the highest reliance on it.

China produces and consumes half of the global production…

… leaving coal-hungry India as the largest importer… despite the fact that also produces substantial amounts at home.
Overall, top exporters of coal briquette are Australia, Indonesia, and Russia. Top importers are India, China, Japan, South Korea, and Taiwan.

Breaking down coal briquettes exports by quality….
![]()
… Russsian coal is cleanest (anthracitic coal) …

… followed by Australian (bituminous coal)…

… then Indonesian… almost all of which gets stays within Asia.

Crude oil is the naturally occuring black liquid that’s drilled out of the ground before being distilled into other products.

Its market size eclipses all others.

The US is currently the leading crude oil producer.

Global production is about 100M barrels per day – most of which is from US, Russia, and OPEC.

Saudia Arabia, Russia, Canada, and Iraq have always been big producers too.

The significant uplift in US production over the last decade is mostly attributed to the Shale Revolution. Fracking (extraction method) shale oil (trapped between shale rock formations) only became commercially viable since around 2010- see Oil Geopolitics: the Shale Saga and Shifting Sands for more.
Venezuela, Saudi Arabia, and Iran have the most reserves though.

While the US leads production (about 18M b/d), it consumes a whopping 20M b/d (see directly above), compared to Saudi Arabia or Russia’s modest 3-4M b/d consumption. This leaves Saudi Arabia, Russia, and Canada as the world’s leading exporters. And the top importers are the same nations that are coal-hungry.

Petroleum suppliers and importers are lot more fragmented. Note that the less industrious countries – Africa and Australia – tend to net import refined petroleum rather than crude oil.

Natural Gas: Used for electricity generation and heating. Top exporters overall are US, Norway, Qatar, Australia, and Russia.
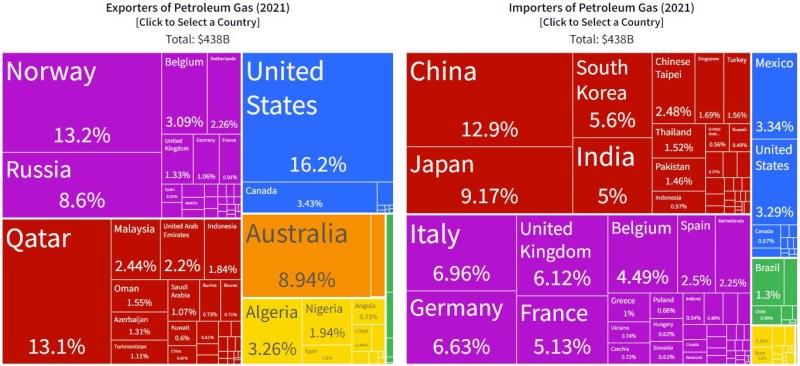
Although if we break this down into its liquefied (liquefied natural gas LNG) vs gaseous state…
Liquefied natural gas (LNG): Australia, US, and Qatar are leading exporters. Most goes to Asia.

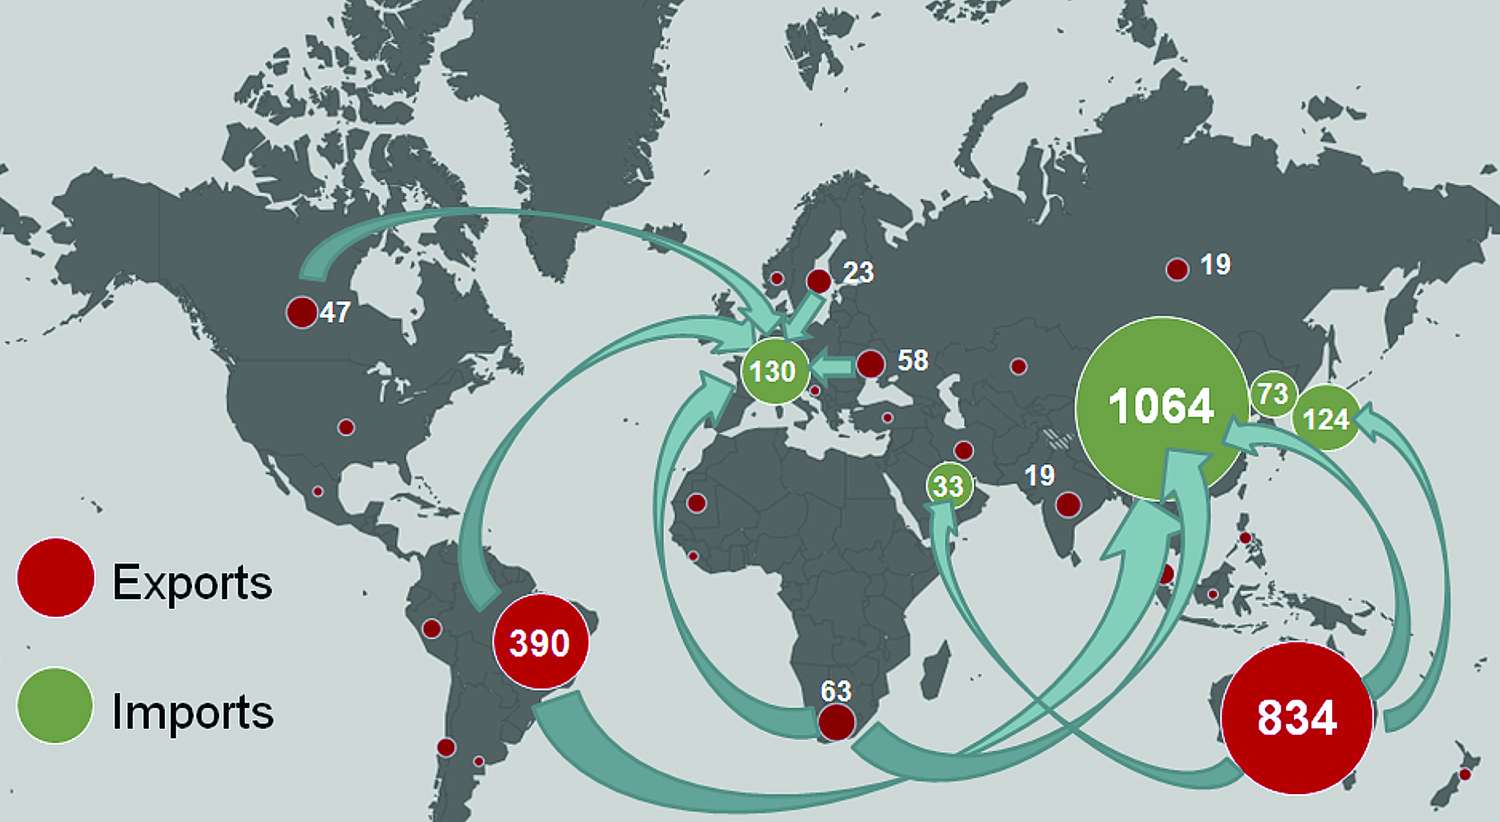
Gaseous state natural gas: Norway and Russia are leading exporters. The big Western European economies are the biggest importers. Much of this is highly dependent on the presence of pipeline infrastructure. Near 100% of European gas goes to Europe, US gas goes to Mexico and Canda, Asian gas goes to China etc.

That wraps up the big 3 mineral fuels – coal, oil, and gas – that dominate the $2.44T mineral fuel category.

Now we move onto metals and their ores.
Iron ore: The sheer tonnage of iron ore mining is astounding.


At $220B, iron ore makes up more than half of the $397B global trade in ores.

When it comes to production, Australia is king. Brazil, China, and India closely follow.

On an export basis, Australia and Brazil’s duopoly is even more apparent.

By now we’ve become accustomised to China being the top importer of everything. Even still, Chinese import demand for iron ore is truly unmatched.

Iron ore is smelted down into iron, and much of this iron is then mixed with carbon to produce steel.
Steel: Used in construction and infrastructure (buildings, bridges, ports, rail), engineering (machinery), transport (cars, trucks, ships). Its production warrants substantial attention because its literally the foundation of heavy industry.

Global steel production has doubled over the last two decades. Almost all of this growth was China.

While China is the world’s leading steel exporter, most of its production is consumed domestically. Production-to-export ratios are much higher in the traditional manufacturing powerhouses: Japan, Russia, South Korea, and Germany.

Below are the components of the $550B of global iron & steel trade.

On top of this $550B, there’s an additional $355B of iron or steel articles – structures, fasteners, pipes, wires, chains etc.

The $550 of iron & steel trade is rather fragmented, and actually quite circular. That is, it’s the same big countries on both exporting and importing.

However, for the additional $355B of iron or steel articles, Chinese export dominance is more evident. US and German imports are more pronounced here, but overall importers remain fragmented.

Going down another level of granularity for either the $550B or $355B aforementioned, we see trends persisting: fragmented importers and Chinese self-sufficiency. However, we see exporters being more specialized. We won’t break them all down here, but just summarise as follows:
- Hot-rolled iron ($74B) comes from Japan, Korea and India. Vietnam and Turkey are notable importers. China is self-sufficient.
- Coated flat-rolled iron ($72B) comes from China and South Korea. Again, China is self-sufficient.
- Ferroalloys ($43B) come from Indonesia, South Africa, and Brazil. China imports a lot. Top 3 ferroalloys are ferro-nickel (28%), ferro-chromium (21%), ferro-silico-manganese (12%).
- Semi-finished iron ($42B) comes from Russia, Ukraine, India, and Brazil.
- Chinese export dominance persists for most components of the $355B iron or steel articles
Scrap iron: Unlike unrenewable fossil fuels, metals are infinitely recyclable. Today about a quarter of global iron production comes from recycling scrap iron.

While steel recycling rates are worryingly low in China, it’s extremely high in the US.

Looking at $56B of global scrap iron trade, we see that the rich countries are the main exporters…

… and that Turkey is the world’s scrap metal recycling compound.

Now we move onto the second most traded ore, and the third most traded metal.

Copper: Primary uses: infrastructure (grid, telco, wiring, circuits, pipes), industrial machinery and electrical devices.

The top producers are also the top exporters: Chile and Peru.

Although Peru primarily exports the ore. The same goes for Indonesia, Mongolia, and Australia. DR Congo and Zambia are notable exporters of copper articles. China, Japan, and Korea eat the world’s copper.

Aluminium is the second most produced metal by tonnage, and second most traded metal by value. Light weight and durability of the metal and its alloys makes it indispensable to the transportation industry (planes, fast trains), and infrastructure. Output rose 300x between 1900-1943 with demand driven primarily for aircraft construction.
To produce aluminium, first bauxite rock is mined. Bauxite is then processed into alumina (via Bayer process). Alumina is then smelted into aluminium (via electrolytic reduction).
Top bauxite producers are: Australia, China, and Guinea.

Guinea, Australia, and Indonesia export the most aluminium ore. However, at only $5.8B, ore trade is relatively small and negligible.

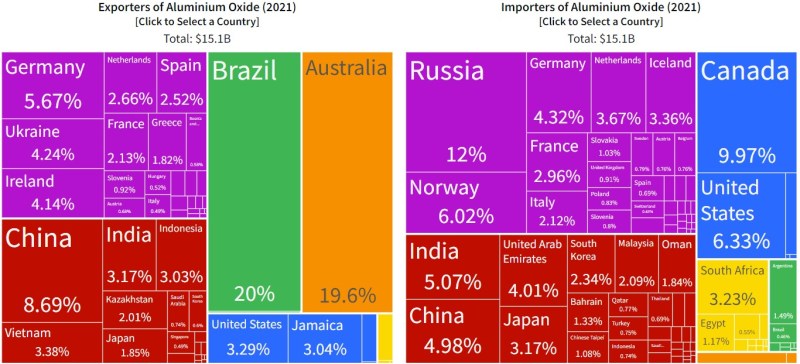
Top alumina producers are: China, Australia, and Brazil.

Aluminium oxide exports confirms the above.
Top aluminium producers are China, India, and Russia.

Like iron and steel, exports and imports are highly fragmented though.

If Europe can continue its shift towards more recycling, its aluminium production will be near self-sufficient in just a few decades.

That was a fairly detailed look into the big 3 metals: iron, copper, and aluminium. For the next several, we’ll be more brief.
Zinc: 3rd most traded ore ($12B) after iron and copper. 5th most traded non-precious metal (after iron, aluminium, copper, nickel). Mostly used to galvanize other metals to prevent rusting. Ore comes from Australia, Peru, US, and Bolivia. Zinc articles trade is $20B – chart excluded as fragmented and uninsightful.

Lead: 4th most traded ore ($8B). 6th most traded non-precious metal. Mostly used for batteries. Ore comes from Mexico, US, Peru, Australia, and Russia. China and Korea import more than half. Lead articles trade was $9B – again, chart excluded as fragmented and uninsightful.

Manganese: 5th most traded ore ($7B). Used to improve steel, in medicine, in petroleum, and some alkaline batteries. South Africa, Gabon, and Gabon dominate exports. Manganese articles trade is only $2B.

Molybdenum: 7th most traded ore. But very low metal articles trade (<$1B). Chile, US, Peru supply the ore.

Nickel: 8th most traded ore (aluminium is 6th). 4th most traded non-precious metal. Used for batteries and coins. Philippines and New Caledonia (accounting for 86% of the country’s exports) supply the ore.

Australia, Canada, and Russia lead nickel articles exports.

Now the precious metals and stones.
Silver: 9th most traded ore. South Africa, Bolivia, and Peru are the top exporters of silver ore.

But silver itself is primarily traded between the world’s financial centres.

Gold: Once dominated by South Africa, top producers are now China, Russia, Australia, and Canada.

The scale of global gold trade is massive. It accounts for over half of the precious metals and stones category.

At $434B, trade volume doubles that of iron ore ($220B) and is on par with natural gas ($438B). Like silver, most trade occurs between the financial centres. When it comes to net imports, Indian demand is notably high.

Most gold mining originates from Africa (note the larger portion of yellow above compared to other commodities we covered so far). In fact, gold is the top export category for many African nations.

Diamond: While not a metal, we’ll cover diamonds now as it should sit next to gold rather than other stones. For $114B of diamonds, we’ll distinguish $69B of worked diamonds (but not set or mount) vs $43B of unworked diamonds, to indicate the change of hands along the value chain.
Officially at least, unworked, raw diamonds come from the rich sub-Saharan African nations, UAE and Belgium. Many unofficial blood diamonds however are sourced around Africa. Most of this ends up in India for processing.

Worked diamonds come out of India and end up in the US or Hong Kong.

Platinum: Trade volume is half that of copper or aluminium, and significantly more than the other metals (nickel, lead etc). Used in automotives, jewellery, and industrial applications. South Africa is the leading exporter.

Next, we’ll cover some additional metals in the context of EV battery manufacturing.
On batteries: Understandably, substantial media attention on monopolised commodity supply chains has revolved around electric vehicle (EV) batteries, and microchips.
The key components (by weight) of an EV battery are: graphite (28%), aluminium (19%), nickel (16%), copper (11%), steel (11%), manganese (5%), cobalt (4%), lithium (3%), and iron (3%). Despite being called ‘lithium-ion’, lithium itself is only a small weight component.

Cobalt: DR Congo is the sole producer and exporter of cobalt. (The negligible $118M trade in cobalt ore accentuates this fact even further).

Lithium production has quadrupled since 2010. Almost all of this demand has been driven by batteries (making up 78% of its consumption in 2021 vs just 23% in 2010). Australia and Chile poduce 70% of the world’s lithium. Although Bolivia and Argentina have the world’s largest reserves.

While there’s no distinct singular category for lithium trade, looking at the minerals from which lithium is extracted from, we note the following complementary to the above: Australia leads various lithium mineral exports (eg spodumeme), Chile and Argentina dominate lithium carbonates, and China lithium oxide.
China has a monopoly on lithium-ion battery manufacturing. Although, this is forecast to be tempered by an American and German comeback.

The key suppliers of EV battery components are China, Australia, Canada, South Africa, Chile, Indonesia, Brazil, and Japan.


Remember, production or export origin is not always the same as mining origin.
China continues to dominate rare earth metal production and exports.
However, China’s monopoly on rare earth metal production is gradually faning.

Quick note on nuclear: Despite its dangers, it wouldn’t be surprising to see nuclear being seriously reconsidered as an energy source. It’s already popular in Europe and other nations that are the least reliant on coal.
Uranium is therefore worth paying attention to, as it’s the most common fuel for electricity generation via nuclear fission. A single 1-inch tall uranium pellet contains as much energy as 1 tonne of coal.
Uranium: Natural uranium production is dominated by Kazakhstan, Canada, Australia, and Namibia.

As we’d expected the top producers (by tonnage) are also the top exporters (by dollars) of natural uranium. Top importers are advanced economies with substantial nuclear energy generation. Note: Canada’s imports are mostly from Kazakhstan, Uzbekistan, and Australia processed for re-export. Also note: At only $80M uranium ore trade is negligible.

Enriched uranium exports, however, are predominantly of European origin.

Salt has all sorts of industrial uses, ranging from construction to industrial production. At only $4B, the edible table salt in our kitchens, is only a fraction of the $60B salt category.

Looking at $60B of global salt trade overall, exporters and importers are highly fragmented.
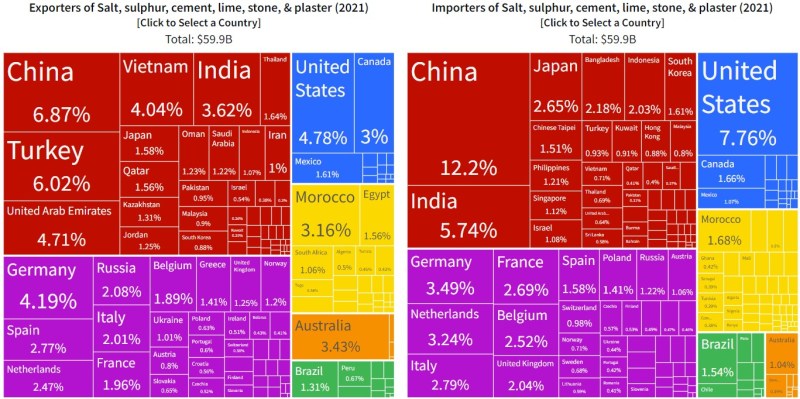
However, a few players clearly emerge when we the two biggest components: cement and sulphur.
Cement demand is fragmented – everyone needs a bit. Although Bangladesh and Philippines show a higher demand proportional to their GDP. Trade flows are highly regionalized: Egyptian cement goes to Africa, Vietnamese to Asia etc. Although Vietnam and Turkey punch above their weight as significant exporters.

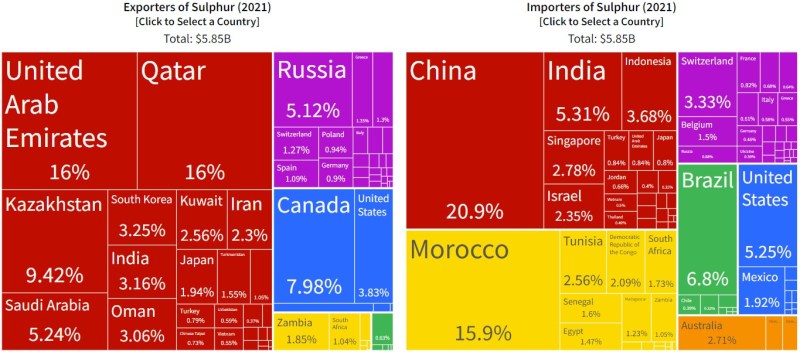
Sulphur is used for car batteries, fertilizer, oil refining, and mining. UAE, Qatar, and Kazakhstan are top exporters. Morrocco imports so much sulphur for phophatic fertilizer production.
Then there’s $211B of glass, stone, and ceramics trade. We won’t go delve into as there’s nothing much insightful here (fragmented exporters and importers).

However we’ll call out that for the biggest category, unglazed ceramic exports, Italy and Spain lead unglazed ceramic exports.

Plastics: Somewhat unexpectedly, the $790B of global plastics trade is not all China.


Rubber:
Natural rubber comes from Southeast Asia: Thailand, Indonesia, Vietnam, Malaysia etc, and Cote d’Ivoire.

Synthetic rubber trade is bigger than natural rubber. Top exporters are Korea, Japan, Thailand, and Vietnam.

Rubber tires exports come from China, Thailand, and Japan. Germany both exports and imports a lot. US is a notable importer.

That’s a wrap for $6.7T of minerals, metals, and industrial materials.

Next in Where Stuff Is Made Part 3, we’ll examine manufactured goods – ranging from everyday consumer goods through to more advanced engineering marvels.
Links to more visuals:
- Annual mineral production ranked by tonnes, from diamond (11t) all way up to sand and gravel (50Bt).
- 35 Minerals Critical to US National Security
- Levels of Competition for Valuable Minerals
If you enjoyed this, you may also enjoy:
Where Stuff Is Made: An Illustrative Overview (Part 1: Agricultural Commodities)
Where Stuff Is Made: An Illustrative Overview (Part 3: Manufactured Goods)
Where Stuff Is Made: An Illustrative Overview (Part 4: Services)